Data Visualization
AKA
Instructional Design
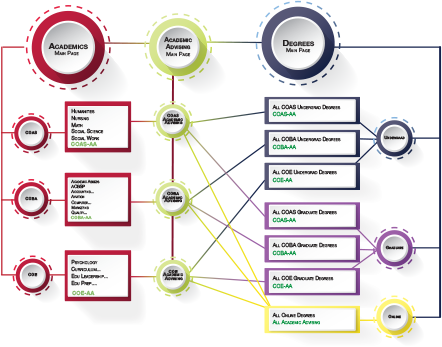
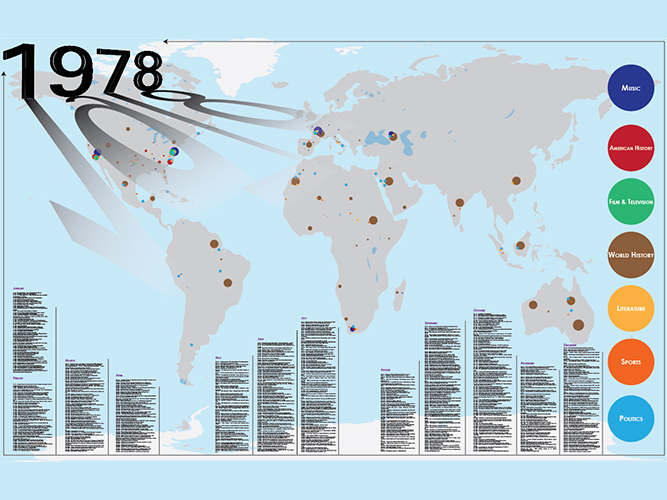
Human eyes are naturally drawn to colors and patterns. We can quickly identify yellow from red, and circle from triangles. Our world culture is visual, including everything from advertisments and art to TV and movies. Data visualization is another form of visual art that grabs our interest and keeps our eyes on the message. When we see a chart, we quickly see trends and outliers. If we can see something, we internalize it quickly. It’s storytelling with a purpose. If you’ve ever stared at a massive spreadsheet of data and couldn’t see a trend, you know how much more effective a visualization can be.